
.png)
11.01.2021 | Case studies
Using state-of-the art techniques to obtain new vibration-based features towards online Machine Learning monitoring. A real industrial use case.
Getting useful and real-life features to feed Machine Learning algorithms is always a challenge. As we always advice, AI technology must work using precise data from the system to be analyzed. To improve Machine Learning algorithms performance, is important to avoid introducing all the available data from sensors without a previous selection and, if needed, development of new features. Electromechanical systems are really common in industry and depending on the analytics need, it is always a challenge to get those high-quality features. Therefore, we want to showcase some approaches that we use in order to guarantee required analytics performance on a high-power (90 kW) three-phase electric motor coupled with a heavy-duty gearbox, used in steel industry. A detailed description of the setup is found below:
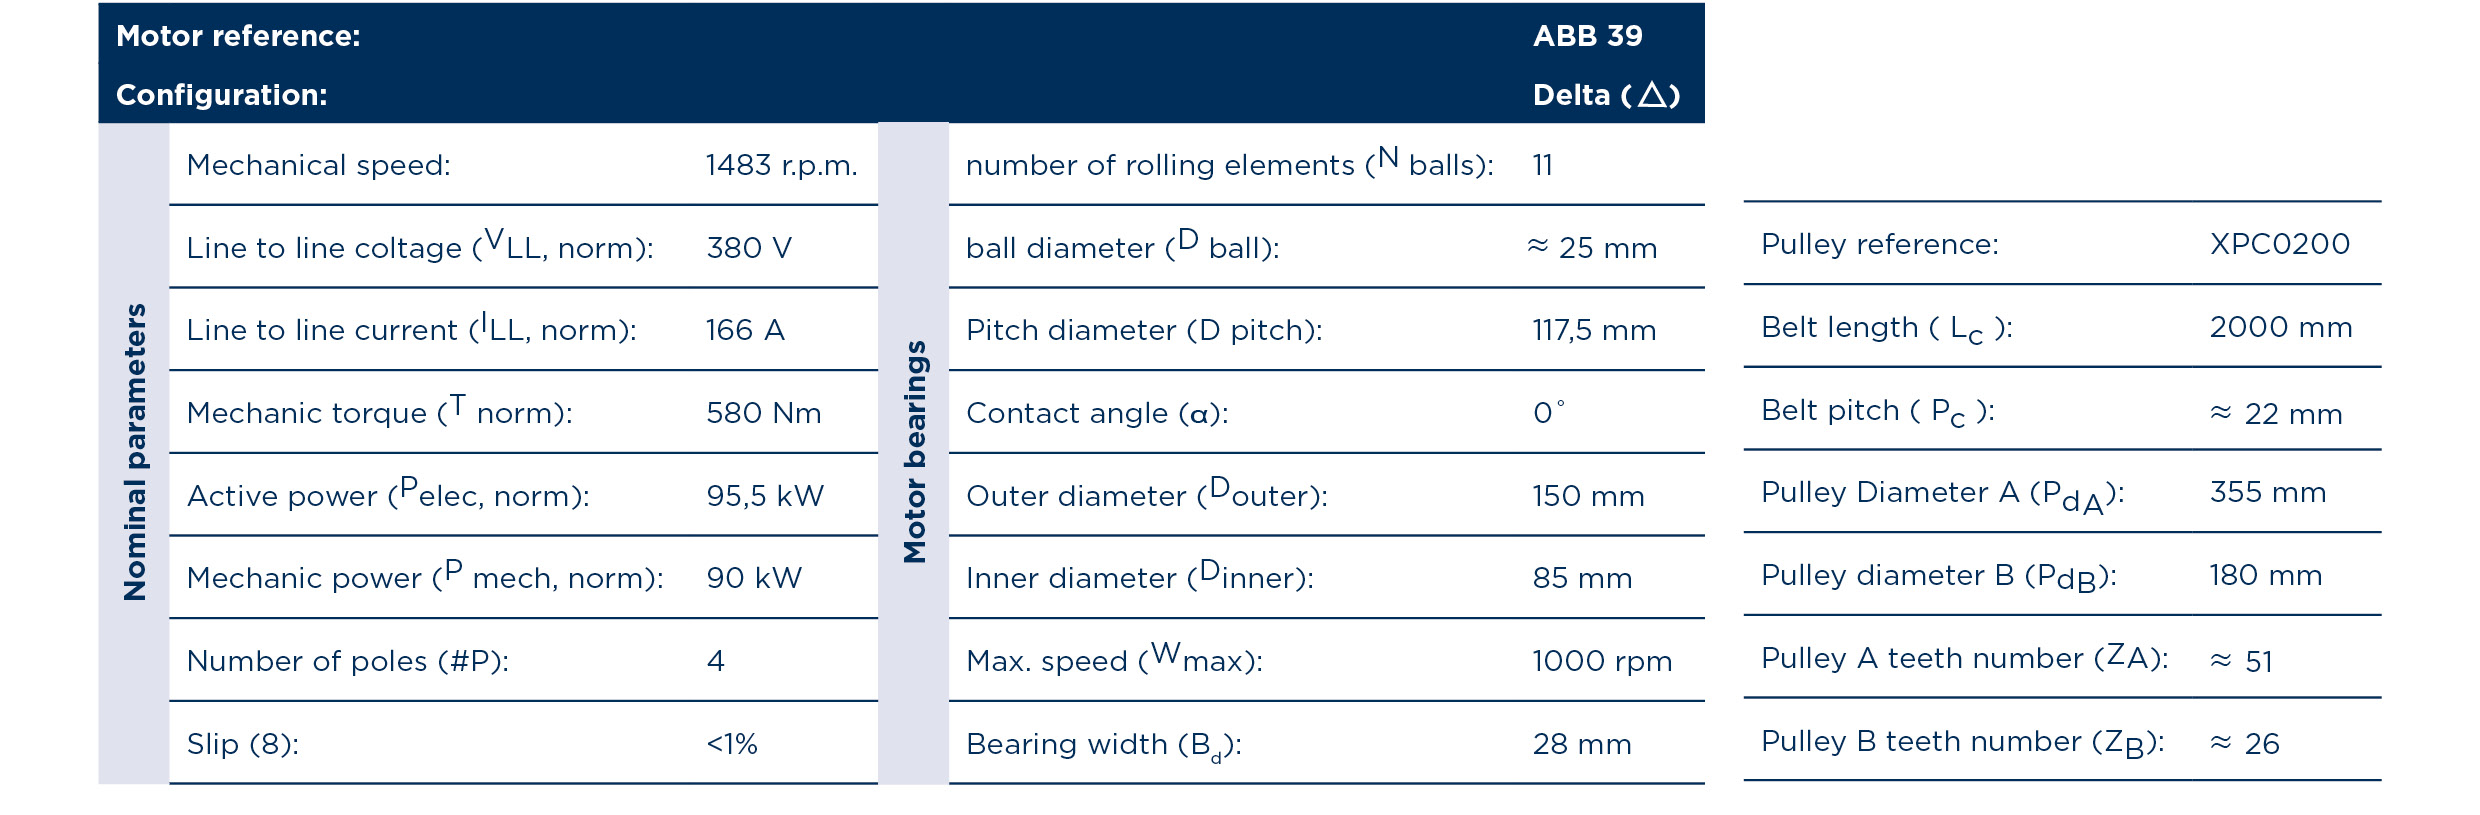
Table 1. Setup Description
In this case, measurements of the mechanical vibrations of this system (4 channels at 19,5 kHz) and its energy consumption (intensity, voltage, active, reactive and apparent power per line sampled at 8kHz) were made using our Aingura Insights computational node. Based on these measurements, the state of different elements such as pulleys, bearings and hydrostatic bearings of the system were estimated.
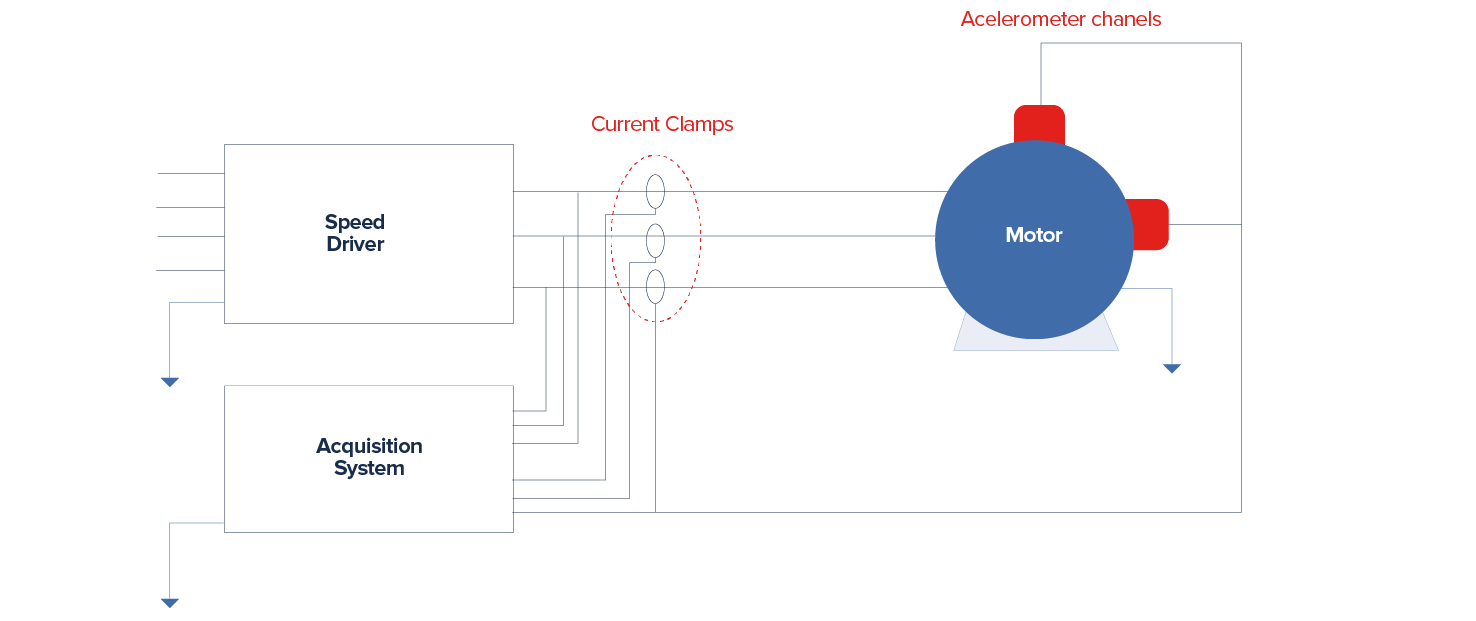
Figure 1. Connection scheme for the acquisition system in the analyzed module.
As is shown in Figure 1, the system was equipped with current clamps and accelerometer channels measuring the electrical power consumption of the three-phase motor and the lateral mechanical vibration of the module.
Measurements of these physical variables were performed for three normal operating conditions and one abnormal operating condition.
The measured signals of the module were analyzed in the transitory regime (during speed changes) and stationary regime (at constant speed). So that the signals were decomposed to get data related to each element of the assembly using time and spectral signal processing techniques.
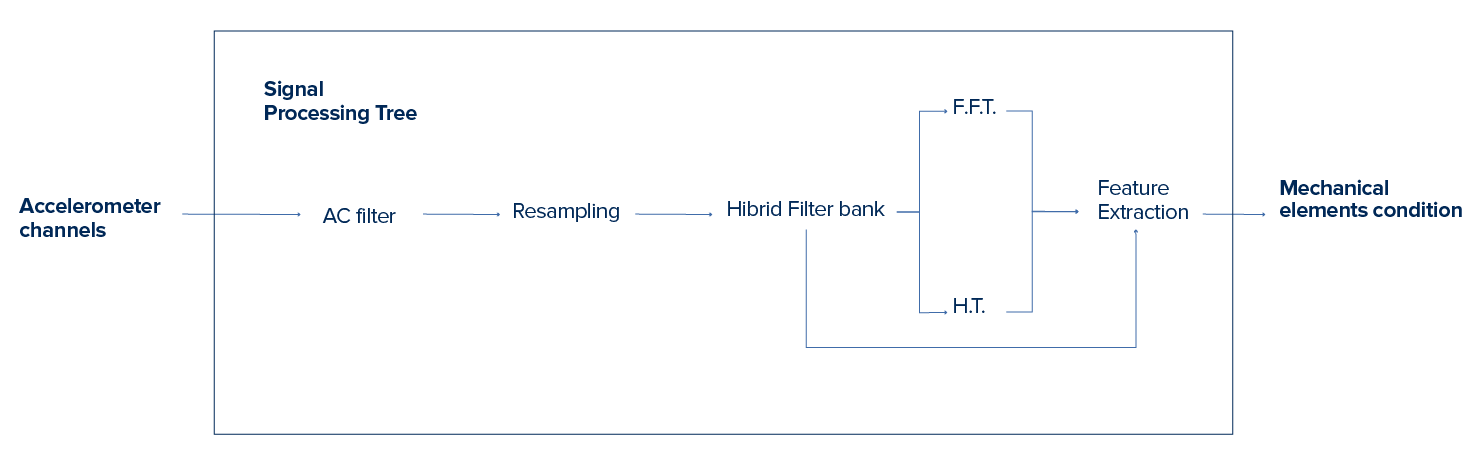
Figure 2. Signal processing tree for mechanical element condition estimation base on the accelerometer channels signals.
Figure 2 shows the processing tree used to decompose the signal of the accelerometer channels. This processing tree is based on time and frequency domain tools and was used to estimate the component of vibration associated with the spectral components of the mechanical elements that are part of the analyzed module.
Steady-state analysis
The Steady-state analysis is a state-of-the-art technique in this field, based on processing and analyzing the signals from the accelerometers when the motor rotates at constant speed. The Fast Fourier transformation (FFT) from the signal processing tree, allows to obtain information about all the periodic components that are part of the signal measured in the steady state. The analyzed frequencies observed for the FFT of the accelerometer signals associated with the coupled mechanical elements of the motor are shown below.
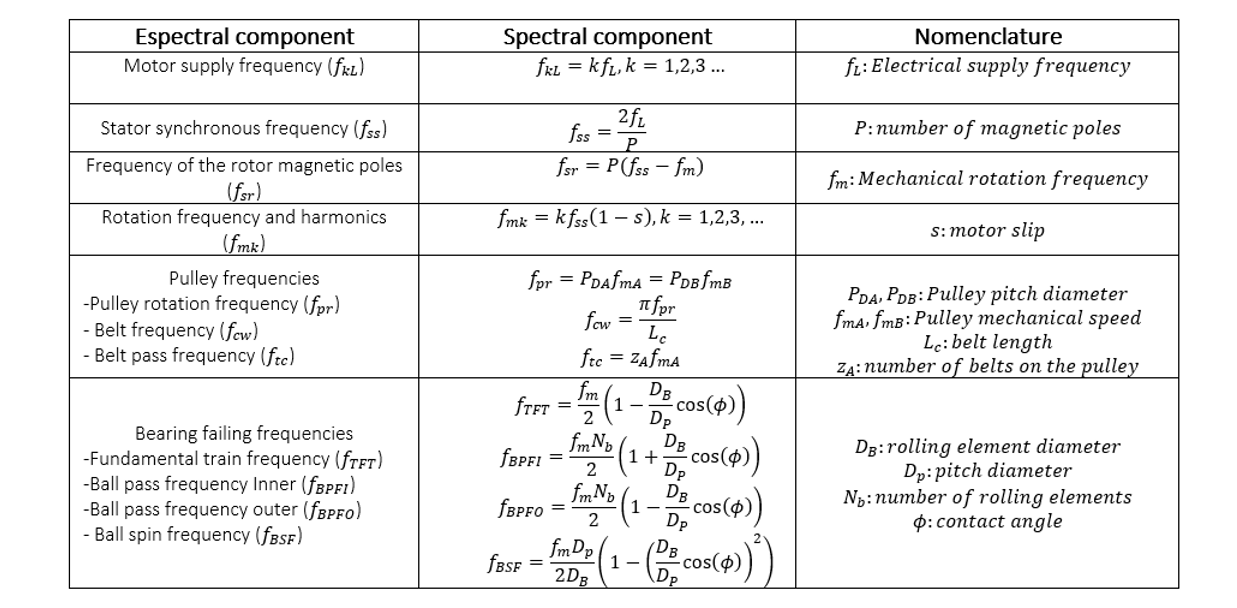
Table 2. Spectral components extracted from the mechanical elements of the analyzed module.
The orbital plots are studied during the steady state of the module. The orbital plots are representations of the trajectory of the center of rotation of the rotor with respect to the clearance of the machine bearings, the construction of these graphs is only possible by measuring the vibration in two directions of the same plane. The construction of these graphs is commonly done for the fm component of the vibration signal.
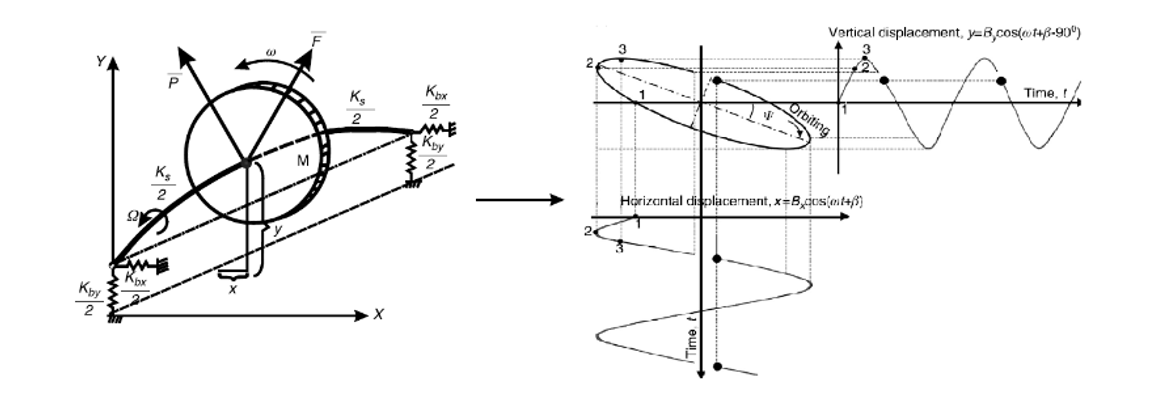
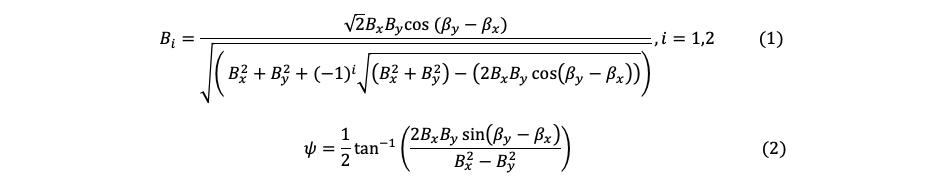
Figure 3. Basic rotor model and construction of its orbit plot.[1]
Figure 3 shows an example of construction of the orbital plot, equations (1) and (2) show the constructive parameters of the formed orbit. The equations shown are based on the simplified model of a rotodynamic system where the parameters Bx,y and βx,y depends on the stiffness, mass and damping of the system, therefore B1,2 and ψ are the major-minor semi radius and the phase of the orbital plot. [1]
Transient analysis
The transient analysis is another technique used by Aingura, based on the analysis of the signals from the accelerometers when the motor is changing its speed. The FFT is not a reliable source of information in conditions where the speed of rotation is not constant, the amplitude and frequency response of various mechanical components will vary in time due to the rotational excitation it is not constant. The natural response of electrical and mechanical systems will be dominant in this state, the identification of the natural responses of the system components were done to diagnose stability and construction characteristics of the system (rigidity, inductances, lubrication ...). The use of the short time Fourier transformation (STFT) and the spectral kurtosis (SK) shown in equation (3) and (4) were used to identify the describe parameters.
The operator <> represents the time average of the STFT s(τ,f).
The short-time Fourier transform is a signal processing method used to identify the evolution of the spectrum over time. This method consists of dividing the analysis signal in time windows and calculating the Fourier transform in each of these, the determination of the division size of the windows depends on the desired resolution of the information in frequency and time. Equation 3 shows the Fourier transform in short time, the function w (t − τ) represents the function of the displaced window with which the data is divided in time.
Spectral kurtosis is a statistical tool that allows us to identify non-stationary behavior in the frequency domain, a low level of kurtosis in frequency implies that there are only stationary phenomena. The presence of a high level of kurtosis at a frequency implies that the signal contains associated transients at these frequencies. This tool is used for fault detection in rotodynamic systems, the equation shows how to determine the kurtosis level for a selected frequency window.
RESULTS
The results of the analysis done for the studied module on the steady and transitory state are:
- Spectral component analysis (Figure 4 and Figure 5):
From the Spectral component analysis, the peaks of the harmonics two and three of the rotational speed show a parabolic behavior when the speed is increased. The parabolic tendency of the fundamental frequency demonstrates unbalance as the dominant phenomenon. Moreover, this behavior correlates the rotational system to a flexible rotor behavior. Additionally, the third harmonic is dominant in several of the experiments, indicating that there is friction due to lack of lubrication in the rolling module bearings.
As for the motor, the magnitude of the peak of the motor power supply frequency and the harmonic two indicates eccentricity in the motor rotor or stator. For the bearing fault frequencies, the frequencies fBPFO and fBPFI show greater amplitude for the two channels on the motor indicating that there is more wear on the bearing races than on the rolling elements or cage. From the frequency components of wear in the pulleys shows that for channel CH1 and CH2 the frequency fcw is greater than the ftc. However, for the CH3, results contradict the trend observed from the other two accelerometers. The lack of trend in the data does not allow to identify if the belt has greater wear compared to the pulleys of the system.
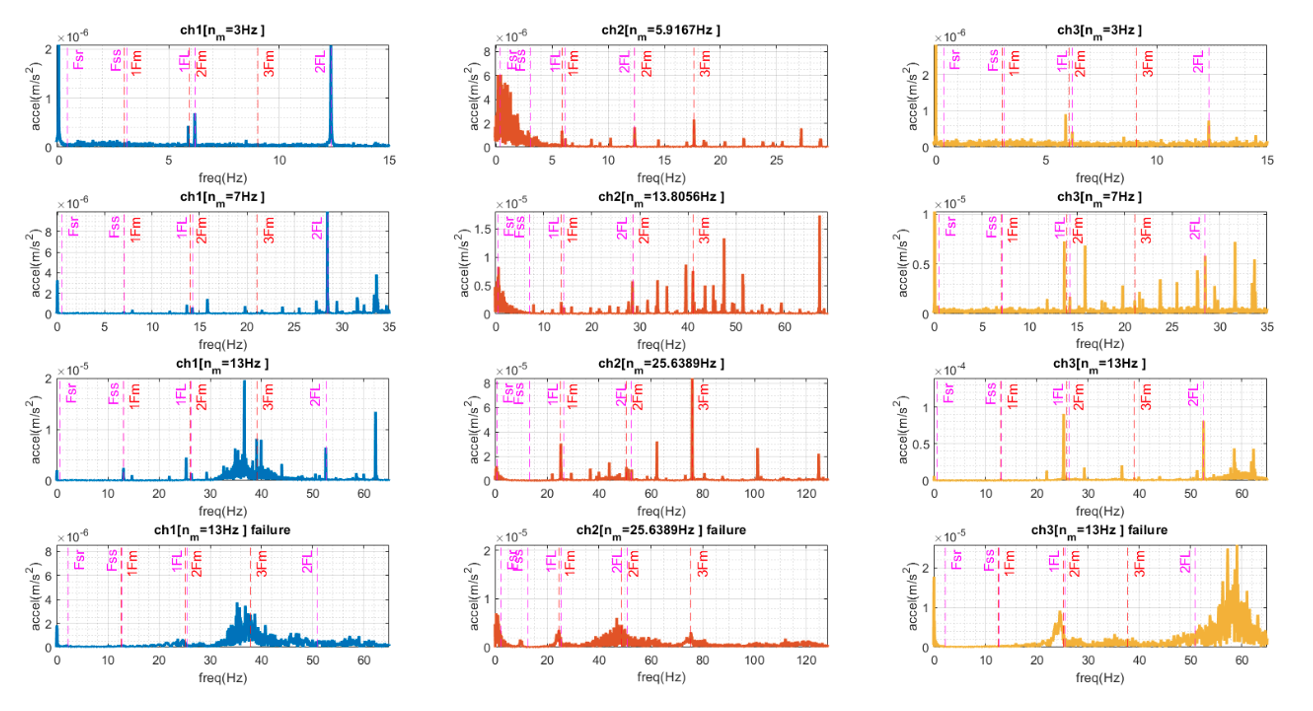
Figure 4. Spectral components of some studied elements during the steady state conditions and the abnormal condition after the application of the signal processing tree for the three channels.
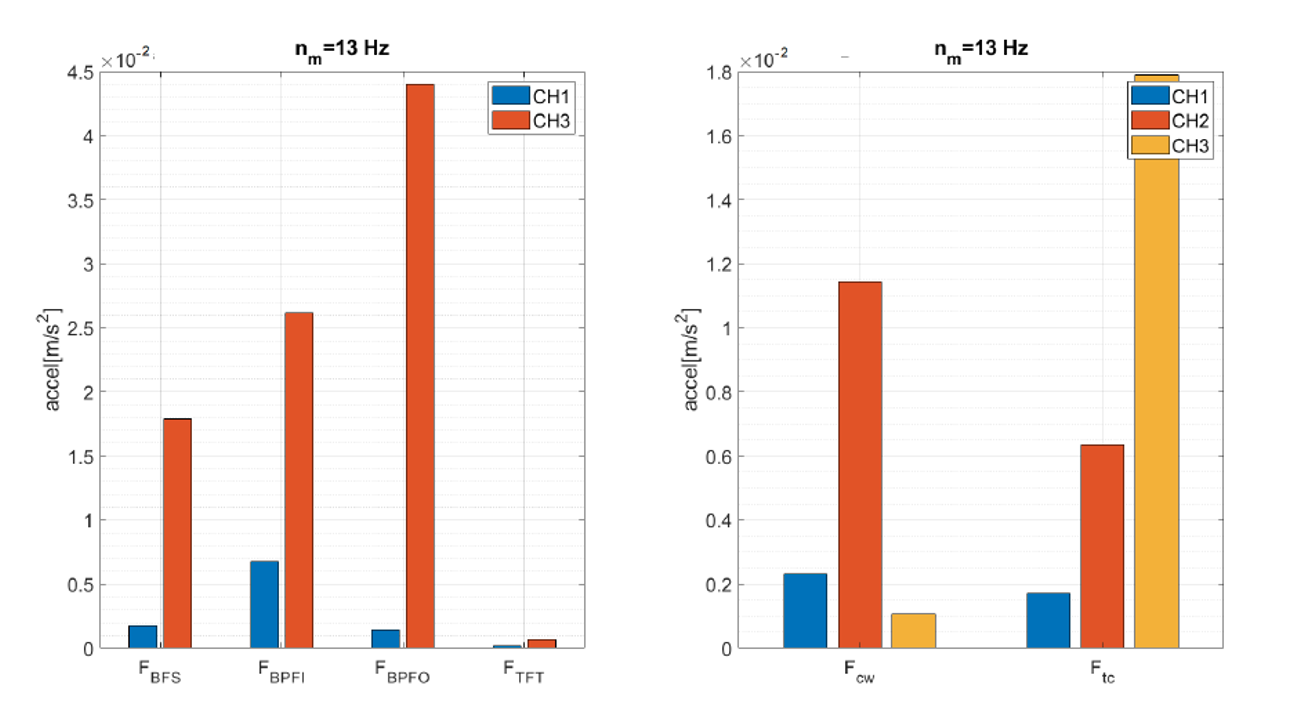
Figure 5 results of amplitudes of wear peaks in rolling bearings and pulleys at 13 hz rotational speed.
- Orbital plots (Figure 6):
The signals of the CH1 and Ch3 channels were filtered and plotted in a polar way for each experiment. The presence of several radius in the shapes of the ellipses indicates instability induced by a noise that is in contact with the rotor. The ellipse of the last experiment shows a more abrupt evolution in the amplitude of the radius, the condition described above demonstrates the instability of the operation of the module during the test.
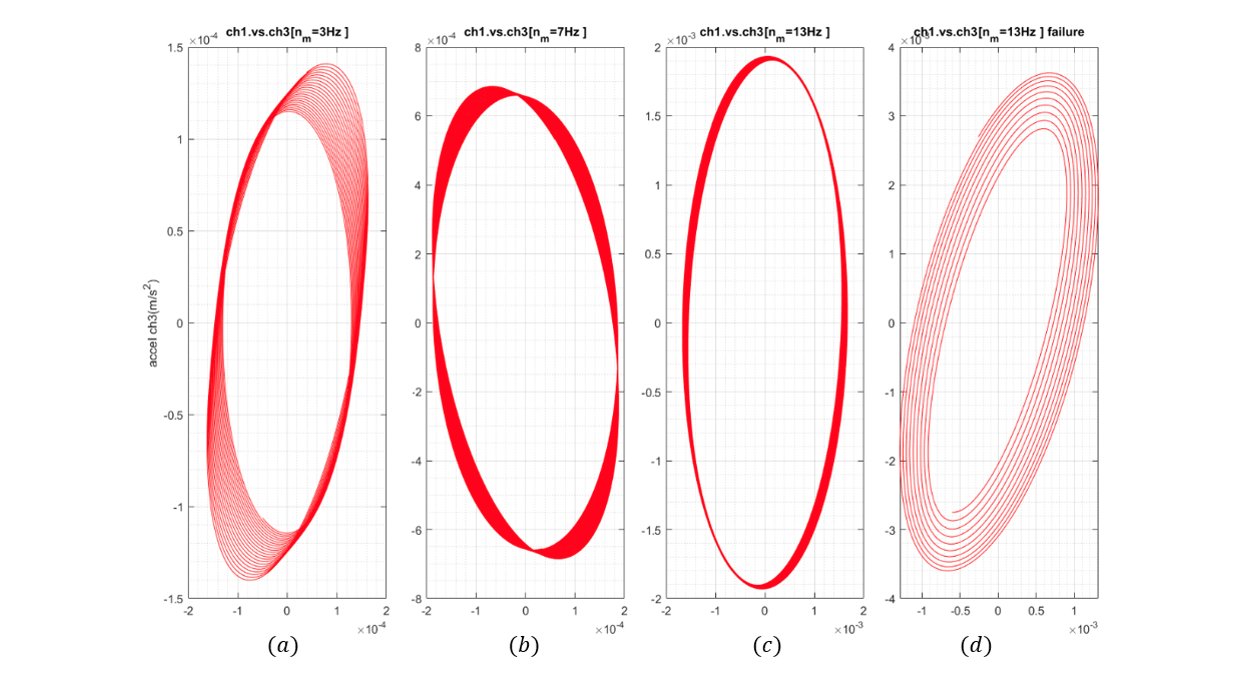
Figure 6. Orbit plot for the lateral vibration of the motor during the steady state conditions (a), (b), (c)and the abnormal condition (d).
- Spectral kurtosis (Figure 7):
From the transient analysis carried out, the natural response of the mechanical elements was identified during the start-up (normal condition) and emergency shutdown (abnormal condition) of the module. During start-up, low-frequency natural frequencies can be observed in the CH1. The presence of these transient components can be attributed to the natural response of the mechanical structure of the start-up assembly. For the CH2 and CH3 channel transient components of average and high frequency can be observed, correlated to the natural response of mechanical elements with teeth or rolling elements and electrical elements at start-up, respectively.
The most dominant frequencies of the module during the failure are between 830-854 Hz, these frequencies may represent the natural response of the element that is presenting the mechanical failure of the system. However, the lack of information on various elements of the module is challenging when trying to identify which element is associated with the failure in a specific way.
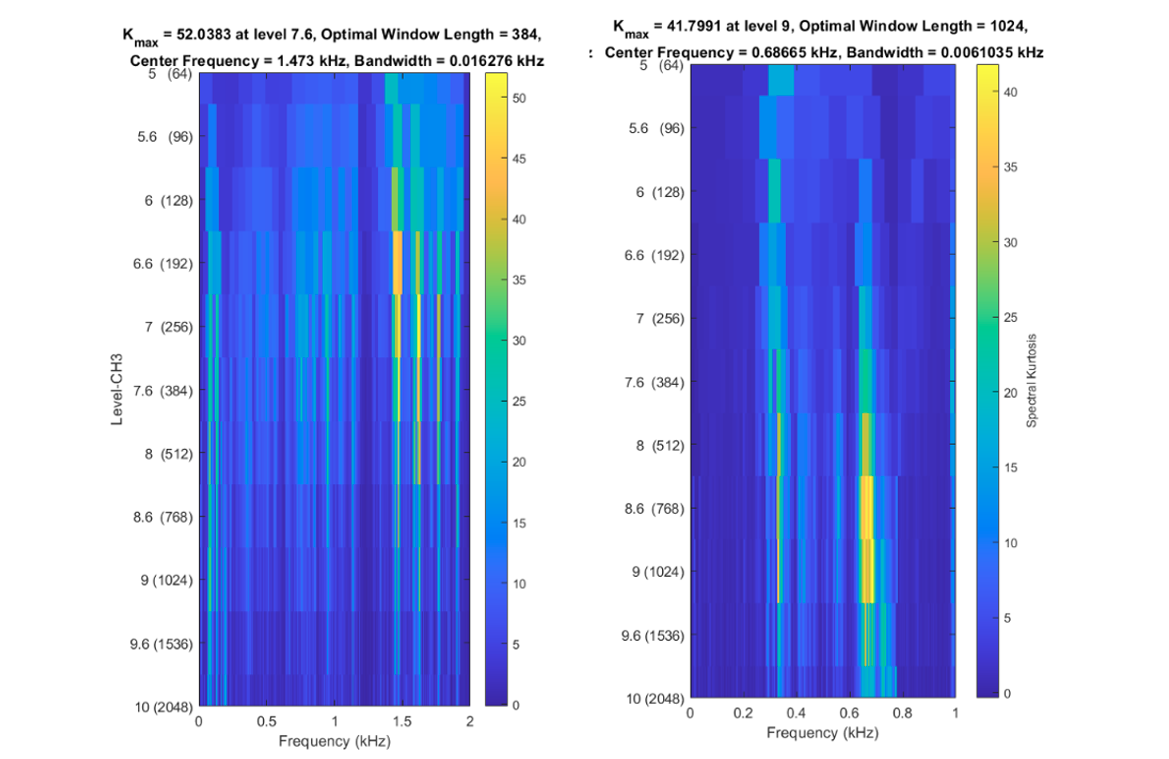
Figure 7. SK of one lateral vibration of the motor during star up transitory condition (a) and during the abnormal condition (b) of the module.
REFERENCES
[1] M. Agnieszka, M. Agnieszka, M. Agnieszka, and M. Agnieszka, Rotordynamics. Taylor and Francis, 2005.