Participants
Talens Systems
Universidad Politécnica de Madrid
impact
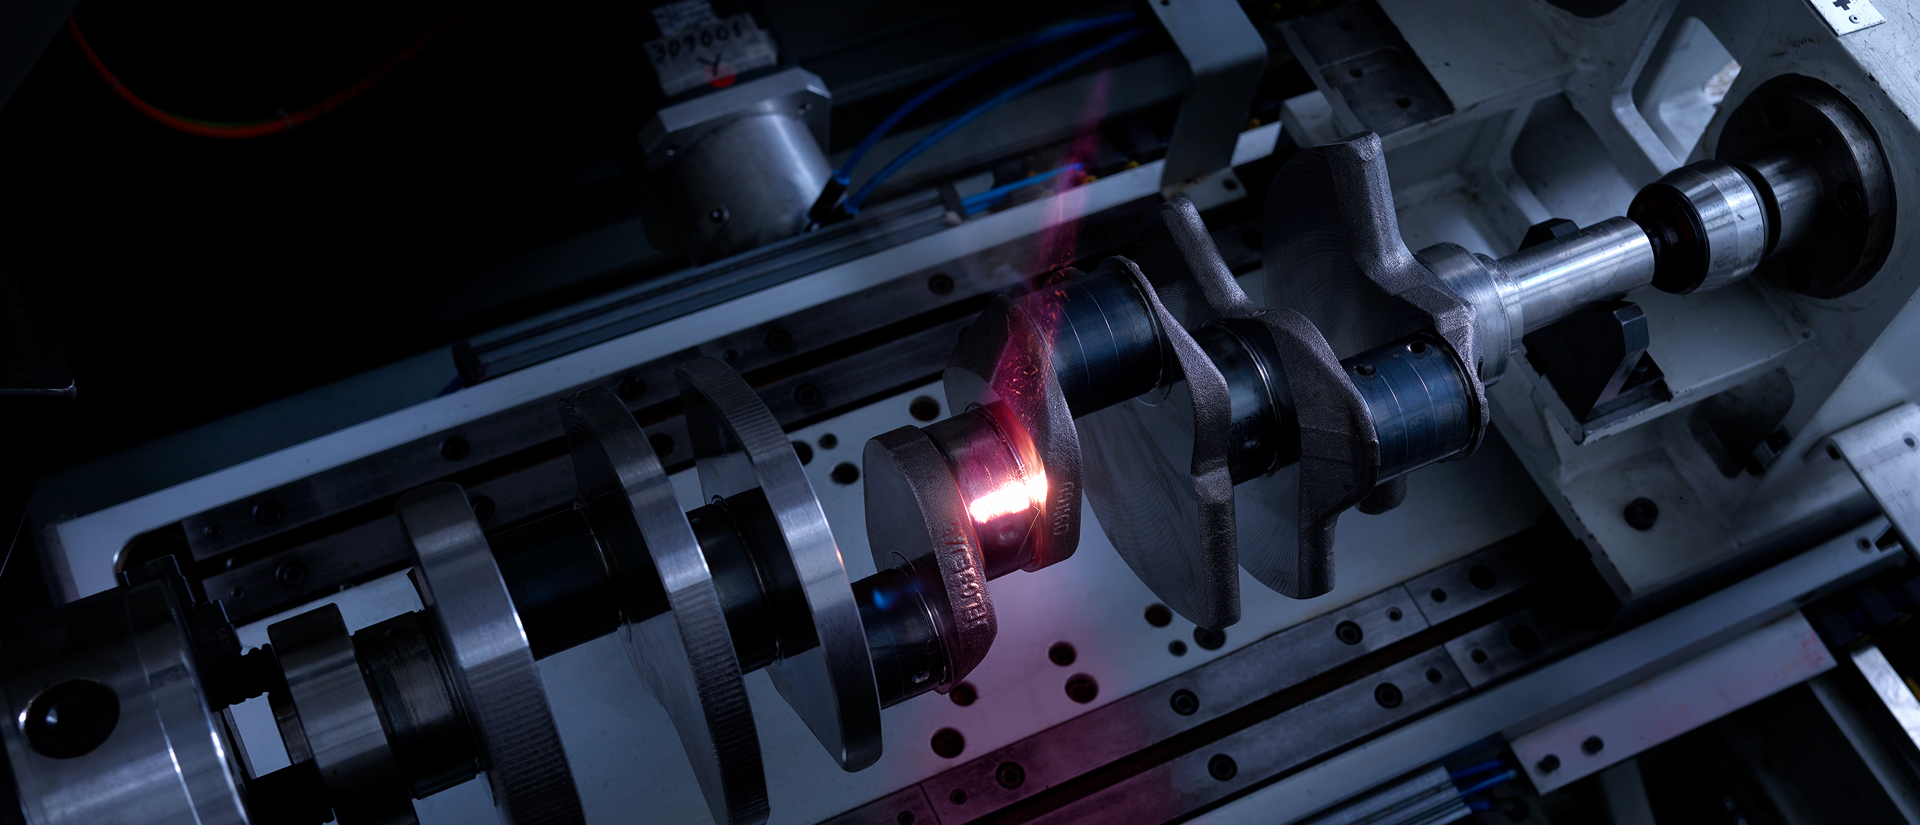
- Detection of anomalies in real process in the manufacture of crankshafts at the OEM’s production facility in the United Kingdom.
- Detected other types of anomalies related to the process and the control of the machine. Avoided the need to increase the destructive tests in tempering process.
- 100% process control without the need to resort to an increase in destructive tests. Reduce the need for destructive testing, significantly reducing production costs.
Developed AI Technologies
- Computer vision and image processing.
- Data intelligence.
- Intelligent automation.
- Machine learning.
- Pattern analysis, prediction and intelligent classification.
Challenges
- To develop a quality control system that allows detect anomalies related to a laser-based hardening system for automotive crankshafts.
- Development of a 100% quality control system to work under 3 seconds per inspected workpiece.
- Application of the Kernel Density Estimation (KDE) machine learning algorithm for the analysis of high-speed (1kHz) thermographic images for the detection of anomalies from the thermal and spatial point of view.
results
- Dataset size: 2GB.
- Number of variables: 1024.
- Sampling time: 1ms.
- A KDE-based algorithm has been developed to detect deviations in the quenching process without preliminary training.
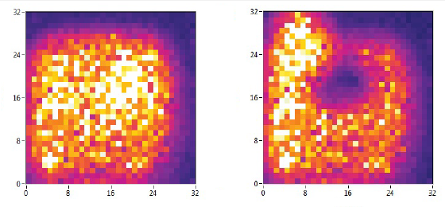
- The algorithm has the ability to detect and calculate an anomaly score based on the readings from the high-speed camera.
|
|
|
Figure 1. High speed thermography image of laser hardening process |
- Additionally, areas of the image have been segmented using an agglomerative clustering algorithm that guarantees the spatio-temporal quality of the segments.
 |
|
Figure 2. Image segmented by agglomerative clustering. |
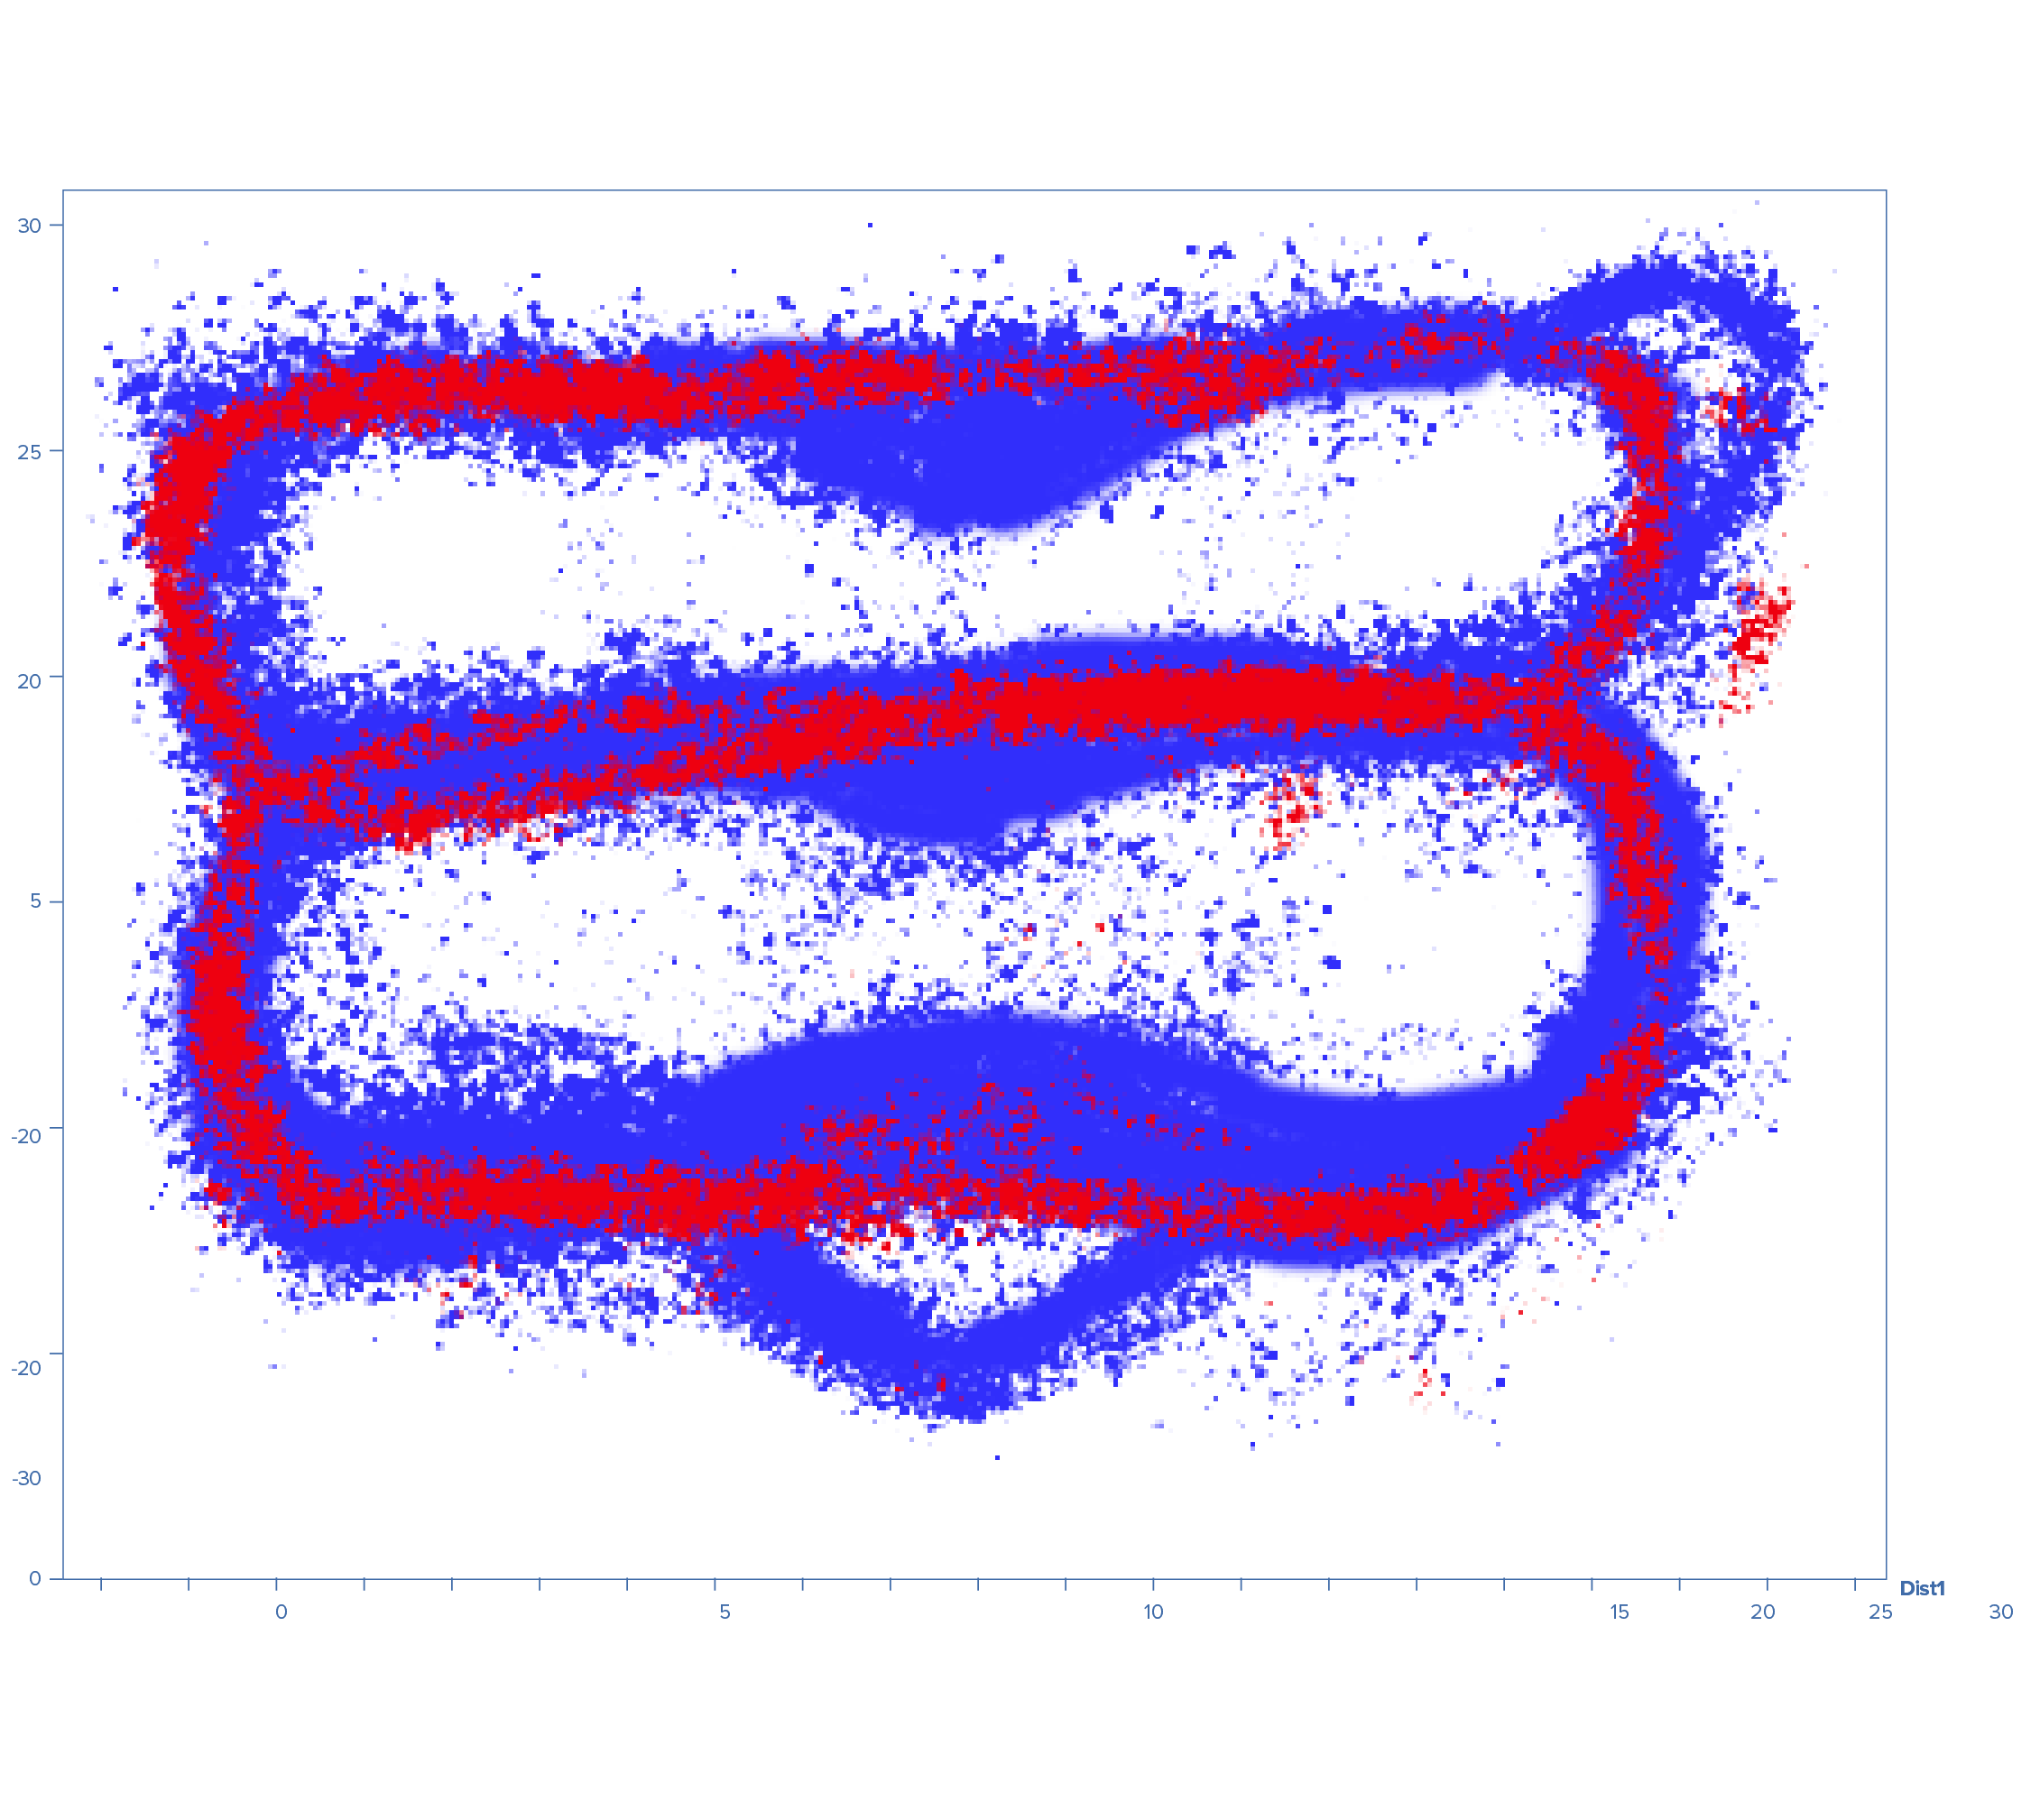
- The position of the laser spot is estimated through the images to make an analysis of the location of the heat spot within the process zone. This also makes it possible to validate the position and status of the scanner system that positions the laser beam on the work surface.
 |
|
Figure 3. Position of the laser spot throughout the process. |


